Dividend Data vs GrowPanel
Side-by-side comparison to help you choose the right tool.
Dividend Data
Instantly automate stock analysis in your spreadsheet with AI-powered data and 30+ years of history.
Last updated: March 11, 2026
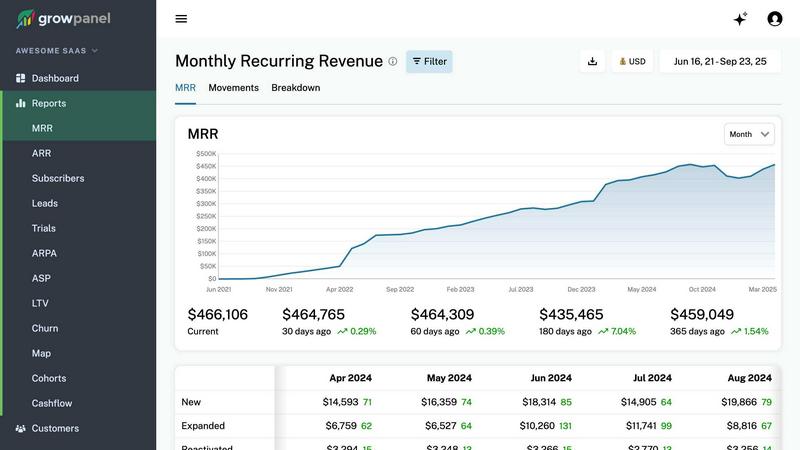
GrowPanel
Unlock real-time SaaS insights with GrowPanel for MRR, churn, and LTV analytics—free until $200k ARR.
Last updated: February 28, 2026
Visual Comparison
Dividend Data

GrowPanel
Feature Comparison
Dividend Data
Live Spreadsheet Integration
This is the core magic. Embed real-time and historical market data directly into your Google Sheets or Excel with simple, custom formulas. No more manual updates, broken API scripts, or flipping between tabs. Your spreadsheet becomes a dynamic, auto-refreshing dashboard. Just input a ticker and a parameter, and data like the current price, next dividend date, or PE ratio appears instantly, keeping your models and trackers perpetually up-to-date with a single click.
Comprehensive Dividend & Fundamental Metrics
Go far beyond basic price quotes. Access a deep library of over 100 metrics specifically curated for fundamental analysis. Pull forward annual dividends, yield, growth rates, and payout ratios for dividend sustainability checks. Dive into full income statements, balance sheets, cash flows, and key ratios like PE, PB, and Debt-to-Equity. This feature provides the complete financial picture needed for rigorous stock evaluation without ever leaving your spreadsheet.
30+ Years of Historical Data
Backtest strategies and analyze long-term trends with confidence. Dividend Data provides an extensive historical database spanning more than three decades for a vast universe of 80,000+ global tickers. Chart dividend growth consistency, examine financial performance through market cycles, and build robust historical models. This depth of historical context is critical for serious investors and is typically locked behind expensive institutional platforms.
AI-Powered Research Assistant (Pro Terminal)
Level up your research with integrated artificial intelligence. The Pro Terminal features an AI Analyst that acts as your personal research assistant. Chat with it to get summaries of company financials, ask complex comparative questions, generate investment theses, and uncover insights from the massive dataset instantly. This turns raw data into actionable intelligence, accelerating the due diligence process dramatically.
GrowPanel
Real-Time Revenue Tracking
GrowPanel offers comprehensive tracking of MRR, ARR, churn, and Lifetime Value (LTV) in real time. This feature enables businesses to monitor their financial performance continuously, allowing for immediate action based on current metrics rather than outdated information.
Cohort Analysis and Trial Insights
With robust cohort analysis, GrowPanel allows users to dissect customer behavior and trial performance. This feature helps identify conversion patterns and retention rates, enabling businesses to optimize their strategies for turning trials into paying customers effectively.
Cash Flow Reporting
This feature provides detailed insights into revenue, refunds, fees, discounts, and taxes. By monitoring cash flow intricacies, businesses can gain clarity on their financial situation, ensuring they manage their resources effectively and avoid potential pitfalls.
AI-Powered Data Interaction
GrowPanel incorporates an AI chat feature that allows users to query their metrics in plain language. This intuitive interface enables users to ask complex questions about their data without needing extensive technical knowledge, making insights more accessible to all team members.
Use Cases
Dividend Data
Automated Dividend Portfolio Tracking
Manually tracking dividend payments, ex-dates, and yields across a portfolio is a tedious relic of the past. Create a master tracker sheet that uses formulas to automatically pull the next ex-dividend date, declared amount, and yield for every holding. Set up conditional formatting to alert you of upcoming payments, and dynamically calculate your portfolio's total forward income and average yield without ever manually inputting a data point.
Building Dynamic Stock Screening Models
Construct powerful stock screens entirely within your spreadsheet. Use functions to pull criteria like PE ratio under 20, dividend yield over 3%, and payout ratio below 60% for a watchlist of tickers. The live formulas allow you to refresh the entire screen with one recalculation, instantly highlighting stocks that meet your evolving investment criteria. This creates a flexible, personalized screening tool far more adaptable than rigid web-based screeners.
Conducting Deep-Dive Fundamental Analysis
Perform comprehensive company analysis on a single sheet. Create a dedicated tab for a stock where you pull 10 years of revenue, EPS, dividend history, and key financial ratios side-by-side. Calculate growth rates, chart trends, and assess financial health directly in Excel or Sheets, using your own formulas alongside Dividend Data's live feeds to build a complete, customizable research report.
Backtesting Investment Strategies
Validate your investment hypotheses with historical data. Use the historical price and dividend functions to simulate how a strategy like "Dogs of the Dow" or a high-yield, low-payout-ratio approach would have performed over the last 10-20 years. Build a backtesting model that calculates total returns, including dividends, to stress-test your strategy's resilience across different market environments before risking capital.
GrowPanel
Enhanced Decision-Making for SaaS Growth
SaaS businesses can leverage GrowPanel to make informed decisions based on real-time insights into their subscription metrics. This data-driven approach allows for swift adjustments to marketing and retention strategies, significantly boosting growth.
Optimizing Trial Conversion Rates
By utilizing GrowPanel's cohort analysis, companies can pinpoint which aspects of their trial offerings are successful and which need improvement. This capability helps in crafting better onboarding experiences to increase conversion rates from trials to paid subscriptions.
Comprehensive Financial Management
Finance teams can utilize GrowPanel to gain a clear picture of cash flow, ensuring that all revenue sources, refunds, and expenses are accounted for. This holistic view helps in strategic planning and enhances financial oversight.
Streamlined Communication through Alerts
GrowPanel's integration with Slack and Teams allows teams to receive alerts and scheduled reports directly in their communication channels. This feature ensures that all stakeholders are informed about critical metrics and changes without having to log in to the platform constantly.
Overview
About Dividend Data
Forget clunky APIs and endless copy-pasting from financial websites. The game has changed. Dividend Data is the disruptive force democratizing institutional-grade stock market intelligence, bringing it directly into the spreadsheets where investors already live. This isn't just another data feed; it's a seamless integration engineered for the modern, data-driven investor. Built by a dividend investor for dividend investors, it transforms Google Sheets and Microsoft Excel into a powerful, live-terminal experience with zero coding required. Simply type intuitive custom formulas like =DIVIDENDDATA_DIVIDENDS("MSFT") and watch as over 30 years of historical data for 80,000+ tickers populates your cells instantly. Access critical metrics: forward yields, payout ratios, ex-dividend dates, full financial statements, valuation ratios, and comprehensive price history. With a radically generous free tier offering 2,500 monthly credits that never expire, it removes all barriers to entry. This tool is built for fundamental and dividend investors who demand depth, accuracy, and efficiency without the bloated cost of traditional Bloomberg terminals, enabling smarter, faster investment decisions directly within their existing workflow.
About GrowPanel
GrowPanel is an innovative subscription analytics platform specifically designed for Software as a Service (SaaS) companies seeking clarity and control over their revenue metrics. It eliminates the chaos associated with spreadsheets by providing real-time, intuitive dashboards that display critical business information such as Monthly Recurring Revenue (MRR), Annual Recurring Revenue (ARR), churn rates, retention statistics, expansion revenue, and cohort analysis. With a seamless one-click connection to billing platforms like Stripe, Chargebee, and Recurly, GrowPanel empowers businesses to gain immediate insights into their financial health. This tool is perfect for SaaS founders, finance teams, and growth strategists who need reliable data to drive their decision-making processes. Its main value proposition lies in delivering actionable insights that help companies scale efficiently and effectively, all while being free until a company reaches $200k in ARR, ensuring accessibility for startups and growing businesses.
Frequently Asked Questions
Dividend Data FAQ
How does the free tier work and what are credits?
The free tier is incredibly robust, offering 2,500 credits per month that never expire. Each data point you pull with a formula (e.g., one cell with =DIVIDENDDATA_QUOTE("AAPL", "price")) typically costs 1 credit. This allows for substantial usage for individual investors tracking a portfolio or analyzing a few companies. There's no trial period; the free tier is permanently available, making it easy to start and scale as needed.
Do I need an API key or coding skills to use it?
Absolutely not. This is the key differentiator. There are no API keys to manage, no scripts to write, and no coding required. You install the add-in from the Google Workspace Marketplace or Microsoft AppSource, and it instantly adds the custom functions to your spreadsheet's formula library. It's designed for investors, not developers.
What data sources does Dividend Data use?
Dividend Data aggregates and cleans data from multiple high-quality, reputable financial data providers to ensure accuracy and comprehensiveness. The specific sources are proprietary, but the focus is on delivering institutional-grade, reliable data for fundamental metrics, dividends, and financial statements, all normalized and ready for analysis in your spreadsheet.
Can I use it in both Google Sheets and Microsoft Excel?
Yes, seamlessly. Dividend Data offers native add-ins for both major spreadsheet platforms. The custom functions and core experience are consistent across Google Sheets and Microsoft Excel. Your workflow remains the same whether you're collaborating online in Sheets or working offline in a desktop Excel file, providing maximum flexibility.
GrowPanel FAQ
What billing platforms can GrowPanel integrate with?
GrowPanel connects seamlessly with major billing platforms including Stripe, Chargebee, and Recurly. This flexibility allows businesses to consolidate their revenue analytics in one place, regardless of their current billing solution.
Is GrowPanel compliant with GDPR regulations?
Yes, GrowPanel is EU-hosted and fully compliant with GDPR regulations. This commitment to data protection ensures that user data is handled with the utmost care and in accordance with legal standards.
How does the AI chat feature work?
The AI chat feature allows users to interact with their data by typing questions in plain language, such as "What is our churn rate this month?" The system provides instant answers, making it easy for users to derive insights without complex navigation.
What happens when my company exceeds $200k in ARR?
Once your company surpasses the $200k ARR threshold, you will transition from the free tier to a paid plan. GrowPanel offers various pricing structures tailored to the needs of growing SaaS businesses, ensuring continued access to critical analytics.
Alternatives
Dividend Data Alternatives
Dividend Data is a specialized financial data tool that delivers over 30 years of stock market history directly into spreadsheets. It falls into the category of fundamental investment research platforms, designed specifically for investors who prioritize dividends and long-term value. Users often explore alternatives to find a better fit for their budget, specific feature requirements like different metrics or data sources, or compatibility with other analysis platforms. When evaluating other options, savvy investors should prioritize a few key areas. Look for the depth and reliability of historical data, especially for dividend history. Consider the ease of integration with your existing workflow, whether that's in Excel, Google Sheets, or another tool. Finally, assess the pricing model transparency and whether the tool's core functions align with your specific investment strategy, be it deep fundamental screening or dividend growth tracking. The right tool should feel like a natural extension of your analysis process, removing data friction so you can focus on making informed decisions.
GrowPanel Alternatives
GrowPanel is a powerful subscription analytics platform designed specifically for SaaS companies, providing real-time insights into crucial revenue metrics such as MRR, ARR, churn, and LTV. Its seamless integration with popular billing systems like Stripe, Chargebee, and Recurly allows users to bypass the chaos of spreadsheets and focus on data-driven decisions. Users often seek alternatives to GrowPanel for various reasons, including pricing structures, specific feature sets, and compatibility with unique platform requirements. When searching for an alternative, it's essential to consider factors like the depth of analytics offered, ease of integration, user interface, and the ability to scale with your business needs.