Banknaked vs Dividend Data
Side-by-side comparison to help you choose the right tool.

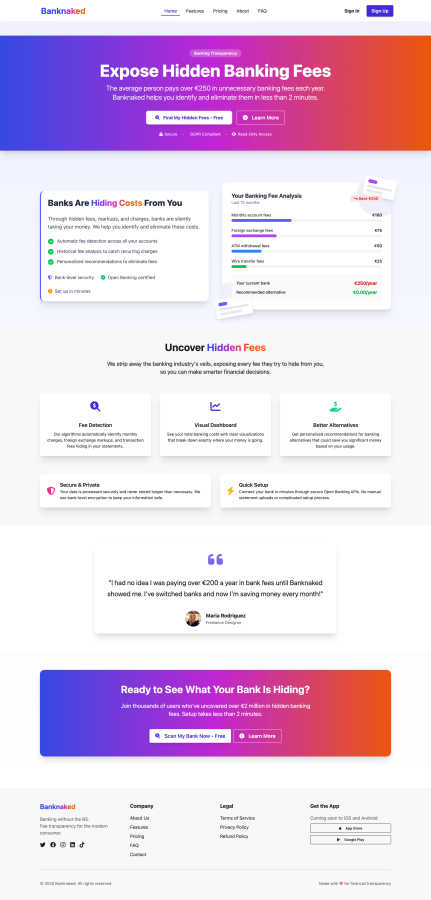
Banknaked
Banknaked reveals hidden bank fees in minutes, empowering you to save money with personalized insights and total.
Last updated: March 1, 2026
Dividend Data
Instantly automate stock analysis in your spreadsheet with AI-powered data and 30+ years of history.
Last updated: March 11, 2026
Visual Comparison
Banknaked
Dividend Data

Feature Comparison
Banknaked
Automatic Fee Detection
Banknaked employs advanced algorithms to automatically detect hidden fees across all your bank accounts. This feature scans your transaction history to identify monthly charges, foreign exchange markups, and transaction fees, ensuring you are aware of every cost impacting your finances.
Historical Fee Analysis
With the historical fee analysis feature, Banknaked allows you to review your banking fees over the last 12 months. This comprehensive overview helps you identify recurring charges and understand spending patterns, enabling you to make more informed decisions regarding your financial habits.
Personalized Recommendations
Based on your unique banking habits, Banknaked provides tailored recommendations for alternative banking options that could save you money. These suggestions are grounded in actual usage, empowering you to switch accounts or negotiate with your current bank for better rates and reduced fees.
Secure and Private Access
Banknaked is designed with your security in mind. The platform uses bank-level encryption to protect your data, while ensuring that it is processed securely. With GDPR compliance and read-only access, you can trust that your information remains confidential and is never stored longer than necessary.
Dividend Data
Live Spreadsheet Integration
This is the core magic. Embed real-time and historical market data directly into your Google Sheets or Excel with simple, custom formulas. No more manual updates, broken API scripts, or flipping between tabs. Your spreadsheet becomes a dynamic, auto-refreshing dashboard. Just input a ticker and a parameter, and data like the current price, next dividend date, or PE ratio appears instantly, keeping your models and trackers perpetually up-to-date with a single click.
Comprehensive Dividend & Fundamental Metrics
Go far beyond basic price quotes. Access a deep library of over 100 metrics specifically curated for fundamental analysis. Pull forward annual dividends, yield, growth rates, and payout ratios for dividend sustainability checks. Dive into full income statements, balance sheets, cash flows, and key ratios like PE, PB, and Debt-to-Equity. This feature provides the complete financial picture needed for rigorous stock evaluation without ever leaving your spreadsheet.
30+ Years of Historical Data
Backtest strategies and analyze long-term trends with confidence. Dividend Data provides an extensive historical database spanning more than three decades for a vast universe of 80,000+ global tickers. Chart dividend growth consistency, examine financial performance through market cycles, and build robust historical models. This depth of historical context is critical for serious investors and is typically locked behind expensive institutional platforms.
AI-Powered Research Assistant (Pro Terminal)
Level up your research with integrated artificial intelligence. The Pro Terminal features an AI Analyst that acts as your personal research assistant. Chat with it to get summaries of company financials, ask complex comparative questions, generate investment theses, and uncover insights from the massive dataset instantly. This turns raw data into actionable intelligence, accelerating the due diligence process dramatically.
Use Cases
Banknaked
Identify Hidden Fees
With Banknaked, users can quickly uncover hidden fees that they may not have been aware of. This feature is particularly useful for individuals who frequently use multiple banking services and want to streamline their finances by eliminating unnecessary costs.
Analyze Monthly Spending
Banknaked allows users to analyze their monthly spending patterns, giving them insight into where their money is going. This feature can help individuals budget more effectively and identify areas where they can cut back on expenses.
Make Informed Banking Decisions
By providing personalized recommendations for alternative banking services, Banknaked empowers users to make informed decisions about their finances. This use case is especially beneficial for those looking to switch banks or negotiate better terms with their current provider.
Enhance Financial Literacy
Using Banknaked encourages users to become more financially literate. By breaking down complex banking fees into understandable terms, users can gain a better grasp of their financial situation and learn to navigate their banking options more effectively.
Dividend Data
Automated Dividend Portfolio Tracking
Manually tracking dividend payments, ex-dates, and yields across a portfolio is a tedious relic of the past. Create a master tracker sheet that uses formulas to automatically pull the next ex-dividend date, declared amount, and yield for every holding. Set up conditional formatting to alert you of upcoming payments, and dynamically calculate your portfolio's total forward income and average yield without ever manually inputting a data point.
Building Dynamic Stock Screening Models
Construct powerful stock screens entirely within your spreadsheet. Use functions to pull criteria like PE ratio under 20, dividend yield over 3%, and payout ratio below 60% for a watchlist of tickers. The live formulas allow you to refresh the entire screen with one recalculation, instantly highlighting stocks that meet your evolving investment criteria. This creates a flexible, personalized screening tool far more adaptable than rigid web-based screeners.
Conducting Deep-Dive Fundamental Analysis
Perform comprehensive company analysis on a single sheet. Create a dedicated tab for a stock where you pull 10 years of revenue, EPS, dividend history, and key financial ratios side-by-side. Calculate growth rates, chart trends, and assess financial health directly in Excel or Sheets, using your own formulas alongside Dividend Data's live feeds to build a complete, customizable research report.
Backtesting Investment Strategies
Validate your investment hypotheses with historical data. Use the historical price and dividend functions to simulate how a strategy like "Dogs of the Dow" or a high-yield, low-payout-ratio approach would have performed over the last 10-20 years. Build a backtesting model that calculates total returns, including dividends, to stress-test your strategy's resilience across different market environments before risking capital.
Overview
About Banknaked
Banknaked is an innovative financial tool crafted to unveil the hidden banking fees that can cost consumers over €250 annually. In a world where financial transparency is paramount, Banknaked employs secure Open Banking technology to link directly to your bank account. This connection allows for a comprehensive analysis, revealing a detailed breakdown of monthly charges, transaction fees, and those often overlooked "miscellaneous" costs that banks prefer to conceal. Designed for the modern consumer, Banknaked prioritizes user privacy with its read-only access, ensuring no funds are moved, while your data remains encrypted and easily deletable. In just a few minutes, users can visualize their total banking fees, receive straightforward explanations, and gain annual projections of these costs. Additionally, Banknaked offers personalized recommendations for more affordable banking alternatives based on actual usage, empowering users to make informed financial decisions. Take charge of your finances today and start understanding where your money truly goes with Banknaked.
About Dividend Data
Forget clunky APIs and endless copy-pasting from financial websites. The game has changed. Dividend Data is the disruptive force democratizing institutional-grade stock market intelligence, bringing it directly into the spreadsheets where investors already live. This isn't just another data feed; it's a seamless integration engineered for the modern, data-driven investor. Built by a dividend investor for dividend investors, it transforms Google Sheets and Microsoft Excel into a powerful, live-terminal experience with zero coding required. Simply type intuitive custom formulas like =DIVIDENDDATA_DIVIDENDS("MSFT") and watch as over 30 years of historical data for 80,000+ tickers populates your cells instantly. Access critical metrics: forward yields, payout ratios, ex-dividend dates, full financial statements, valuation ratios, and comprehensive price history. With a radically generous free tier offering 2,500 monthly credits that never expire, it removes all barriers to entry. This tool is built for fundamental and dividend investors who demand depth, accuracy, and efficiency without the bloated cost of traditional Bloomberg terminals, enabling smarter, faster investment decisions directly within their existing workflow.
Frequently Asked Questions
Banknaked FAQ
How does Banknaked ensure my data is secure?
Banknaked utilizes bank-level encryption and is fully GDPR compliant. The platform only has read-only access to your banking data, ensuring that no money is moved and your information remains safe and private.
How quickly can I see my banking fees?
You can set up your Banknaked account and start seeing your banking fees in less than two minutes. The platform is designed for quick and easy access to your financial data.
What types of fees can Banknaked detect?
Banknaked can detect a variety of fees, including monthly account maintenance fees, foreign exchange charges, ATM withdrawal fees, and wire transfer costs. The platform aims to provide a comprehensive overview of all banking-related charges.
Can I delete my data if I no longer want to use Banknaked?
Yes, your data is easily deletable. Banknaked prioritizes user privacy, allowing you to manage your information according to your preferences at any time.
Dividend Data FAQ
How does the free tier work and what are credits?
The free tier is incredibly robust, offering 2,500 credits per month that never expire. Each data point you pull with a formula (e.g., one cell with =DIVIDENDDATA_QUOTE("AAPL", "price")) typically costs 1 credit. This allows for substantial usage for individual investors tracking a portfolio or analyzing a few companies. There's no trial period; the free tier is permanently available, making it easy to start and scale as needed.
Do I need an API key or coding skills to use it?
Absolutely not. This is the key differentiator. There are no API keys to manage, no scripts to write, and no coding required. You install the add-in from the Google Workspace Marketplace or Microsoft AppSource, and it instantly adds the custom functions to your spreadsheet's formula library. It's designed for investors, not developers.
What data sources does Dividend Data use?
Dividend Data aggregates and cleans data from multiple high-quality, reputable financial data providers to ensure accuracy and comprehensiveness. The specific sources are proprietary, but the focus is on delivering institutional-grade, reliable data for fundamental metrics, dividends, and financial statements, all normalized and ready for analysis in your spreadsheet.
Can I use it in both Google Sheets and Microsoft Excel?
Yes, seamlessly. Dividend Data offers native add-ins for both major spreadsheet platforms. The custom functions and core experience are consistent across Google Sheets and Microsoft Excel. Your workflow remains the same whether you're collaborating online in Sheets or working offline in a desktop Excel file, providing maximum flexibility.
Alternatives
Banknaked Alternatives
Banknaked is an innovative financial tool designed to help consumers uncover hidden bank fees that can add up to significant costs each year. By leveraging advanced Open Banking technology, Banknaked connects to your bank account to provide a detailed analysis of your monthly charges, transaction fees, and even those mysterious miscellaneous costs that banks often keep under wraps. This platform falls under the Business & Finance category, aiming to empower users to take control of their finances and make informed decisions. Users often seek alternatives to Banknaked for various reasons, including pricing, specific features that cater to unique financial needs, or compatibility with different platforms. When looking for an alternative, it's essential to consider factors such as user privacy, the comprehensiveness of fee detection, and the quality of visualizations and insights provided. A good alternative should not only identify hidden fees but also offer personalized recommendations that align with your banking habits.
Dividend Data Alternatives
Dividend Data is a specialized financial data tool that delivers over 30 years of stock market history directly into spreadsheets. It falls into the category of fundamental investment research platforms, designed specifically for investors who prioritize dividends and long-term value. Users often explore alternatives to find a better fit for their budget, specific feature requirements like different metrics or data sources, or compatibility with other analysis platforms. When evaluating other options, savvy investors should prioritize a few key areas. Look for the depth and reliability of historical data, especially for dividend history. Consider the ease of integration with your existing workflow, whether that's in Excel, Google Sheets, or another tool. Finally, assess the pricing model transparency and whether the tool's core functions align with your specific investment strategy, be it deep fundamental screening or dividend growth tracking. The right tool should feel like a natural extension of your analysis process, removing data friction so you can focus on making informed decisions.