Fusedash vs StatPecker
Side-by-side comparison to help you choose the right tool.
Fusedash transforms raw data into interactive dashboards and charts, enabling teams to act on insights instantly.
Last updated: March 4, 2026

StatPecker
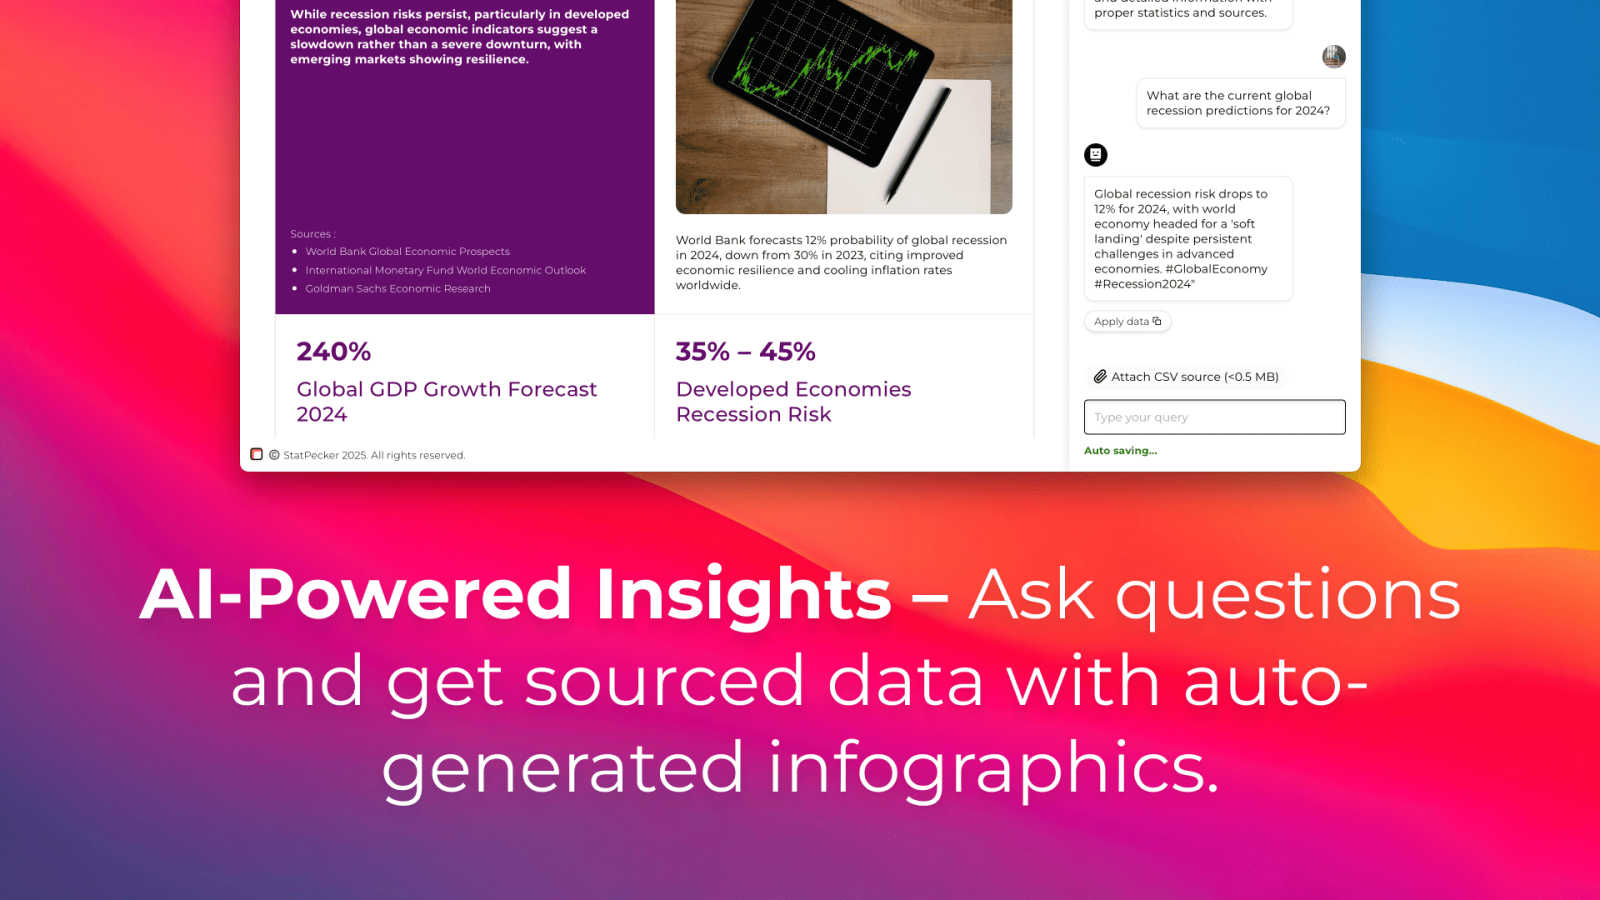
StatPecker delivers fast, secure data insights and stunning visuals, empowering leaders and creators to tell compelling.
Last updated: March 1, 2026
Visual Comparison
Fusedash

StatPecker
Feature Comparison
Fusedash
Flexible Views
Fusedash offers the ability to create tailored dashboard views for different audiences. Teams can transform the same dataset into various formats, including dashboards, charts, maps, and report-style views. This customization allows stakeholders to focus on what matters most without the need for lengthy back-and-forth discussions, improving clarity and efficiency.
AI Chart Generator
The AI Chart Generator within Fusedash allows users to create visually appealing and informative charts quickly from CSV files or APIs. This feature enables users to select the most appropriate chart type, apply comparisons, and refine labels, ensuring that each visual effectively communicates the intended story. Charts can be easily integrated into dashboards or used as standalone visuals for reporting purposes.
Dashboard Software
Fusedash provides a comprehensive workspace for building dashboards and reports. This feature allows users to combine performance metrics with narrative insights, providing critical context that explains changes in data. By blending monitoring and storytelling, Fusedash helps teams stay aligned and minimizes the risk of conflicting reports, ensuring everyone is on the same page.
AI Chat
The AI Chat feature enhances user experience by enabling plain language queries about data. Users can ask questions, explore various breakdowns, and receive suggestions for the best metrics and visualizations. This intuitive interaction allows teams to quickly turn insights into shareable dashboard views, making data exploration more accessible and efficient.
StatPecker
Local SQL Agent
StatPecker's Local SQL Agent empowers users to analyze data locally with an easy-to-use interface. By uploading a CSV file (up to 50 MB), users can run queries and receive instant visualizations that can be shared effortlessly. This feature ensures privacy, as all data processing occurs on the user's device, eliminating concerns about data security.
Ask Your Query
With the Ask Your Query feature, users can generate insights directly by posing questions in natural language. This AI-driven capability removes the need for complex commands or extensive training, allowing users to quickly obtain validated answers from their data. It streamlines the exploration process, making data-driven insights accessible to everyone.
Publish & Embed
StatPecker allows users to publish and embed their infographics seamlessly into various platforms, including blogs, articles, and websites. This feature enhances interactivity and engagement, enabling content creators to integrate visually compelling data narratives that resonate with their audience and drive higher engagement rates.
Download & Use Anywhere
Users can easily export their infographics as image files, making it convenient to use them in reports, presentations, or any other medium. The Download & Use Anywhere feature empowers users to leverage their visuals across multiple platforms without limitations, ensuring that impactful data storytelling is always at hand.
Use Cases
Fusedash
Marketing Analytics
Marketing teams can leverage Fusedash to visualize campaign performance metrics and track KPIs in real-time. By creating tailored dashboards, they can analyze customer engagement, conversion rates, and ROI, enabling data-driven decision-making that optimizes marketing strategies.
Sales Performance Monitoring
Sales teams can utilize Fusedash to monitor their performance metrics and identify trends in sales data. By using interactive dashboards, they can gain insights into sales cycles, customer segmentation, and territory performance, helping them make informed decisions that drive growth.
Financial Reporting
Finance departments can benefit from Fusedash by creating detailed financial reports that incorporate real-time data. With the ability to define consistent metrics, they can ensure accuracy in reporting, analyze trends over time, and present findings to stakeholders with clarity and context.
Operational Efficiency Tracking
Operations teams can use Fusedash to track efficiency metrics and monitor key performance indicators. By visualizing operational data, they can identify bottlenecks, optimize processes, and ensure resources are allocated effectively to enhance overall productivity.
StatPecker
Content Creation for Blogs
Bloggers can leverage StatPecker to create stunning infographics that enhance their articles. By transforming complex data into visual stories, they can increase reader engagement and comprehension, making their content more shareable and appealing.
Marketing Campaign Reports
Marketers can utilize StatPecker to visualize campaign performance data effectively. By generating clear and impactful reports, they can present insights to stakeholders in a visually engaging manner, aiding in decision-making and strategy adjustments.
Educational Presentations
Educators can simplify complex subjects by using StatPecker to create infographics that illustrate key concepts. This visual approach enhances students' understanding and retention of information, making learning more interactive and enjoyable.
Data Analysis for Businesses
Analysts can use StatPecker to quickly visualize data from CSV files without the need for extensive BI tools. This ability to generate instant insights helps businesses make informed decisions based on credible data, driving productivity and efficiency.
Overview
About Fusedash
Fusedash is an innovative AI-powered data visualization platform that revolutionizes how teams interact with their data. It simplifies the process of transforming connected data into clear, actionable insights by acting as a unified workspace. With Fusedash, users can create decision-ready dashboards, interactive charts, detailed maps, and narrative reports without the hassle of rebuilding logic across multiple disconnected tools. The platform is designed for teams that are tired of manual reporting cycles and conflicting data narratives. By defining key metrics and KPIs once, Fusedash ensures that every team member—from leadership to marketing to operations—works with the same trusted numbers. This consistency not only enhances efficiency but also fosters alignment across the organization. Fusedash empowers users to monitor real-time data while providing insights into the reasons behind trends through advanced drill-down capabilities. With integrated AI features, such as natural language data chat and smart visualization assistance, Fusedash makes data exploration and reporting faster and more accessible, turning raw data into a shared source of truth that drives informed decision-making and strategic action.
About StatPecker
In today's data-driven landscape, the ability to present information in an engaging and visually appealing manner is crucial. StatPecker revolutionizes this need with its AI-powered platform that transforms raw data into captivating infographics in mere seconds. Designed for a diverse audience, from content creators and marketers to analysts and educators, StatPecker eliminates the headache of traditional data visualization tools. Users can effortlessly convert complex datasets into clear visuals that enhance communication and decision-making. With StatPecker, the process of data storytelling is simplified, allowing users to focus on insights rather than technical hurdles. The platform's promise of fast, cost-effective, and hassle-free data visualization enables anyone to create professional-grade graphics that captivate audiences and drive engagement.
Frequently Asked Questions
Fusedash FAQ
What types of data can I connect to Fusedash?
Fusedash supports a wide range of data sources, including CSV files, APIs, and public datasets. This flexibility allows users to consolidate various data points into a single platform for comprehensive analysis and reporting.
How does Fusedash ensure consistency in reporting?
Fusedash enables users to define key metrics and KPIs only once, which can then be reused across all dashboards, charts, and reports. This standardization ensures that every team member is viewing the same trusted data, reducing discrepancies and conflicting reports.
Can I customize the visualizations in Fusedash?
Yes, Fusedash offers extensive customization options for visualizations. Users can adjust layouts, filters, and time ranges, allowing them to tailor the data views to meet the specific needs of different stakeholders and audiences.
Is Fusedash suitable for teams with varying data expertise?
Absolutely. Fusedash is designed for users of all skill levels. With its intuitive interface and AI-powered features, even those with limited data expertise can easily navigate the platform, ask questions, and generate insightful reports.
StatPecker FAQ
How secure is my data when using StatPecker?
StatPecker prioritizes data privacy by processing all information locally on your device. This means that your data remains secure and is not transmitted over the internet, ensuring confidentiality.
Can I embed my infographics in social media?
Yes, StatPecker allows you to publish and embed your infographics across various platforms, including social media, blogs, and websites. This feature helps increase visibility and engagement with your content.
Is there a learning curve to using StatPecker?
Not at all! StatPecker is designed for users of all skill levels. Its intuitive interface and natural language query feature make it easy for anyone to generate insights and create stunning visuals without prior experience.
What types of files can I analyze with StatPecker?
Currently, StatPecker supports CSV file uploads, allowing users to analyze datasets of up to 50 MB. This capability enables users to extract valuable insights from their existing data without the need for complex software.
Alternatives
Fusedash Alternatives
Fusedash is an advanced AI-powered data visualization platform that enables teams to transform their raw data into clear, actionable insights through decision-ready dashboards, interactive charts, and detailed reports. As part of the Analytics & Data and Business Intelligence categories, Fusedash simplifies data exploration and reporting, making it a vital tool for organizations looking to align their teams around trusted metrics. Users often seek alternatives to Fusedash for various reasons, including pricing, specific feature sets, or particular platform needs that better fit their operational requirements. When considering alternatives, it's essential to evaluate the platform's usability, integration capabilities, support options, and the flexibility to customize dashboards and reports. A solid alternative should also provide an intuitive interface and ensure consistency in data reporting across all departments.
StatPecker Alternatives
StatPecker is an innovative tool that harnesses the power of AI to deliver fast and secure insights from data, focusing on creating stunning visualizations. As a leader in the analytics and data category, it empowers users to turn complex datasets into impactful infographics effortlessly. However, users often seek alternatives due to various reasons such as pricing constraints, the need for specific features, or compatibility with different platforms. When searching for an alternative, it's essential to consider factors like ease of use, the ability to integrate with existing tools, the quality of visualizations produced, and the overall value provided. A good alternative should streamline the data storytelling process while still offering robust analytical capabilities and exceptional support for users of all skill levels.