
StatPecker
StatPecker delivers fast, secure data insights and stunning visuals, empowering leaders and creators to tell compelling.
About StatPecker
In today's data-driven landscape, the ability to present information in an engaging and visually appealing manner is crucial. StatPecker revolutionizes this need with its AI-powered platform that transforms raw data into captivating infographics in mere seconds. Designed for a diverse audience, from content creators and marketers to analysts and educators, StatPecker eliminates the headache of traditional data visualization tools. Users can effortlessly convert complex datasets into clear visuals that enhance communication and decision-making. With StatPecker, the process of data storytelling is simplified, allowing users to focus on insights rather than technical hurdles. The platform's promise of fast, cost-effective, and hassle-free data visualization enables anyone to create professional-grade graphics that captivate audiences and drive engagement.
Features of StatPecker
Local SQL Agent
StatPecker's Local SQL Agent empowers users to analyze data locally with an easy-to-use interface. By uploading a CSV file (up to 50 MB), users can run queries and receive instant visualizations that can be shared effortlessly. This feature ensures privacy, as all data processing occurs on the user's device, eliminating concerns about data security.
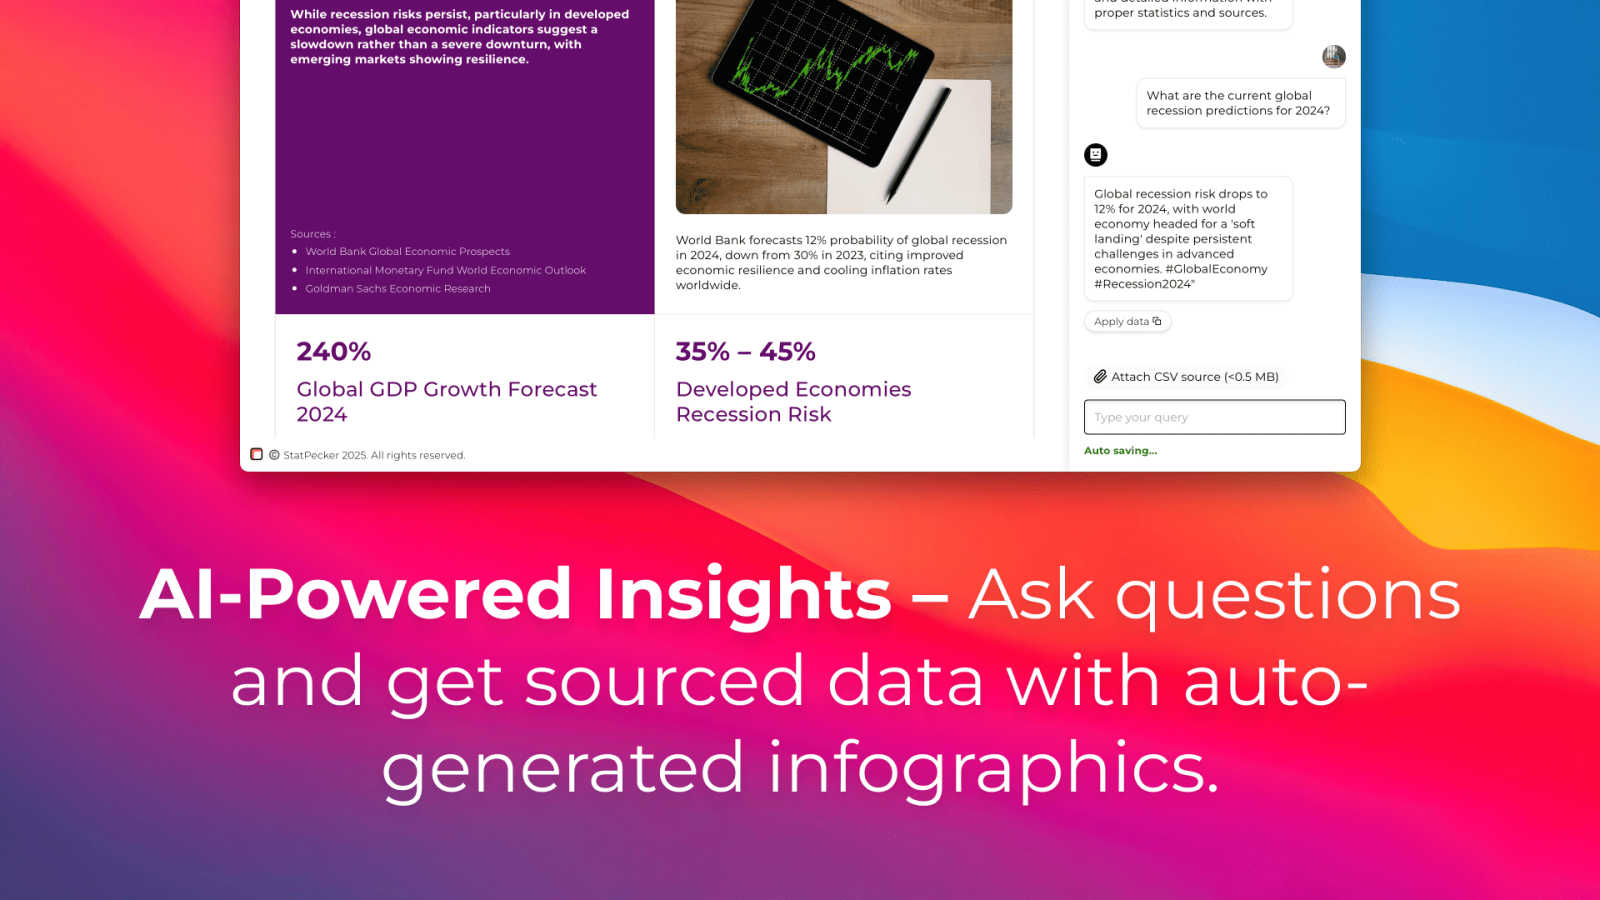
Ask Your Query
With the Ask Your Query feature, users can generate insights directly by posing questions in natural language. This AI-driven capability removes the need for complex commands or extensive training, allowing users to quickly obtain validated answers from their data. It streamlines the exploration process, making data-driven insights accessible to everyone.
Publish & Embed
StatPecker allows users to publish and embed their infographics seamlessly into various platforms, including blogs, articles, and websites. This feature enhances interactivity and engagement, enabling content creators to integrate visually compelling data narratives that resonate with their audience and drive higher engagement rates.
Download & Use Anywhere
Users can easily export their infographics as image files, making it convenient to use them in reports, presentations, or any other medium. The Download & Use Anywhere feature empowers users to leverage their visuals across multiple platforms without limitations, ensuring that impactful data storytelling is always at hand.
Use Cases of StatPecker
Content Creation for Blogs
Bloggers can leverage StatPecker to create stunning infographics that enhance their articles. By transforming complex data into visual stories, they can increase reader engagement and comprehension, making their content more shareable and appealing.
Marketing Campaign Reports
Marketers can utilize StatPecker to visualize campaign performance data effectively. By generating clear and impactful reports, they can present insights to stakeholders in a visually engaging manner, aiding in decision-making and strategy adjustments.
Educational Presentations
Educators can simplify complex subjects by using StatPecker to create infographics that illustrate key concepts. This visual approach enhances students' understanding and retention of information, making learning more interactive and enjoyable.
Data Analysis for Businesses
Analysts can use StatPecker to quickly visualize data from CSV files without the need for extensive BI tools. This ability to generate instant insights helps businesses make informed decisions based on credible data, driving productivity and efficiency.
Frequently Asked Questions
How secure is my data when using StatPecker?
StatPecker prioritizes data privacy by processing all information locally on your device. This means that your data remains secure and is not transmitted over the internet, ensuring confidentiality.
Can I embed my infographics in social media?
Yes, StatPecker allows you to publish and embed your infographics across various platforms, including social media, blogs, and websites. This feature helps increase visibility and engagement with your content.
Is there a learning curve to using StatPecker?
Not at all! StatPecker is designed for users of all skill levels. Its intuitive interface and natural language query feature make it easy for anyone to generate insights and create stunning visuals without prior experience.
What types of files can I analyze with StatPecker?
Currently, StatPecker supports CSV file uploads, allowing users to analyze datasets of up to 50 MB. This capability enables users to extract valuable insights from their existing data without the need for complex software.
Explore more in this category:
Similar to StatPecker
EnsembleData
EnsembleData provides real-time social media data APIs for scalable extraction of posts, profiles, and analytics to drive business insights.
Ribbi
Ribbi is a self-evolving AI agent that automates your entire social media workflow from content creation to performance tracking.
Subiq
Subiq simplifies SaaS subscription management for small teams, ensuring you track costs, avoid wasted spend, and never miss a renewal.
Toon Tone
Toon Tone is a viral daily browser game that sharpens your color memory by matching original cartoon characters using HSB sliders.
MStudio
MStudio transforms scripts into captivating storyboards and pitch-ready campaigns with advanced AI, streamlining your creative process.
Alma by Olivares AI
Alma is your AI assistant that remembers, researches, and creates across image, video, and music—all for a single monthly fee.