Skippership vs StatPecker
Side-by-side comparison to help you choose the right tool.
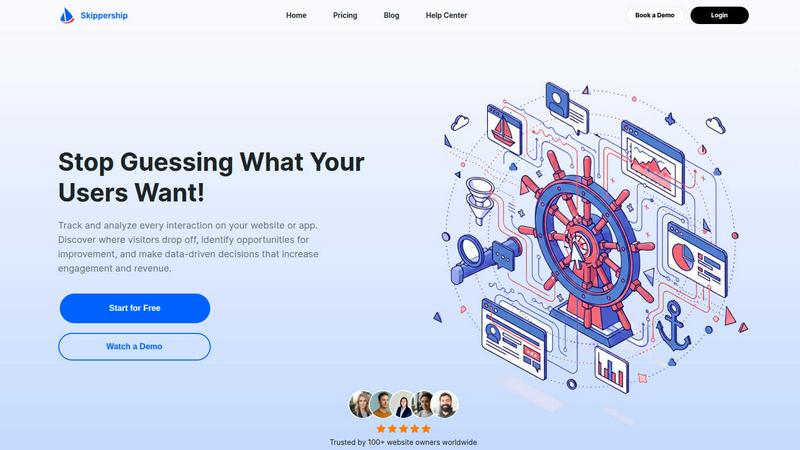
Skippership
Skippership uses AI to analyze user behavior, revealing drop-off points to optimize engagement.
Last updated: February 28, 2026

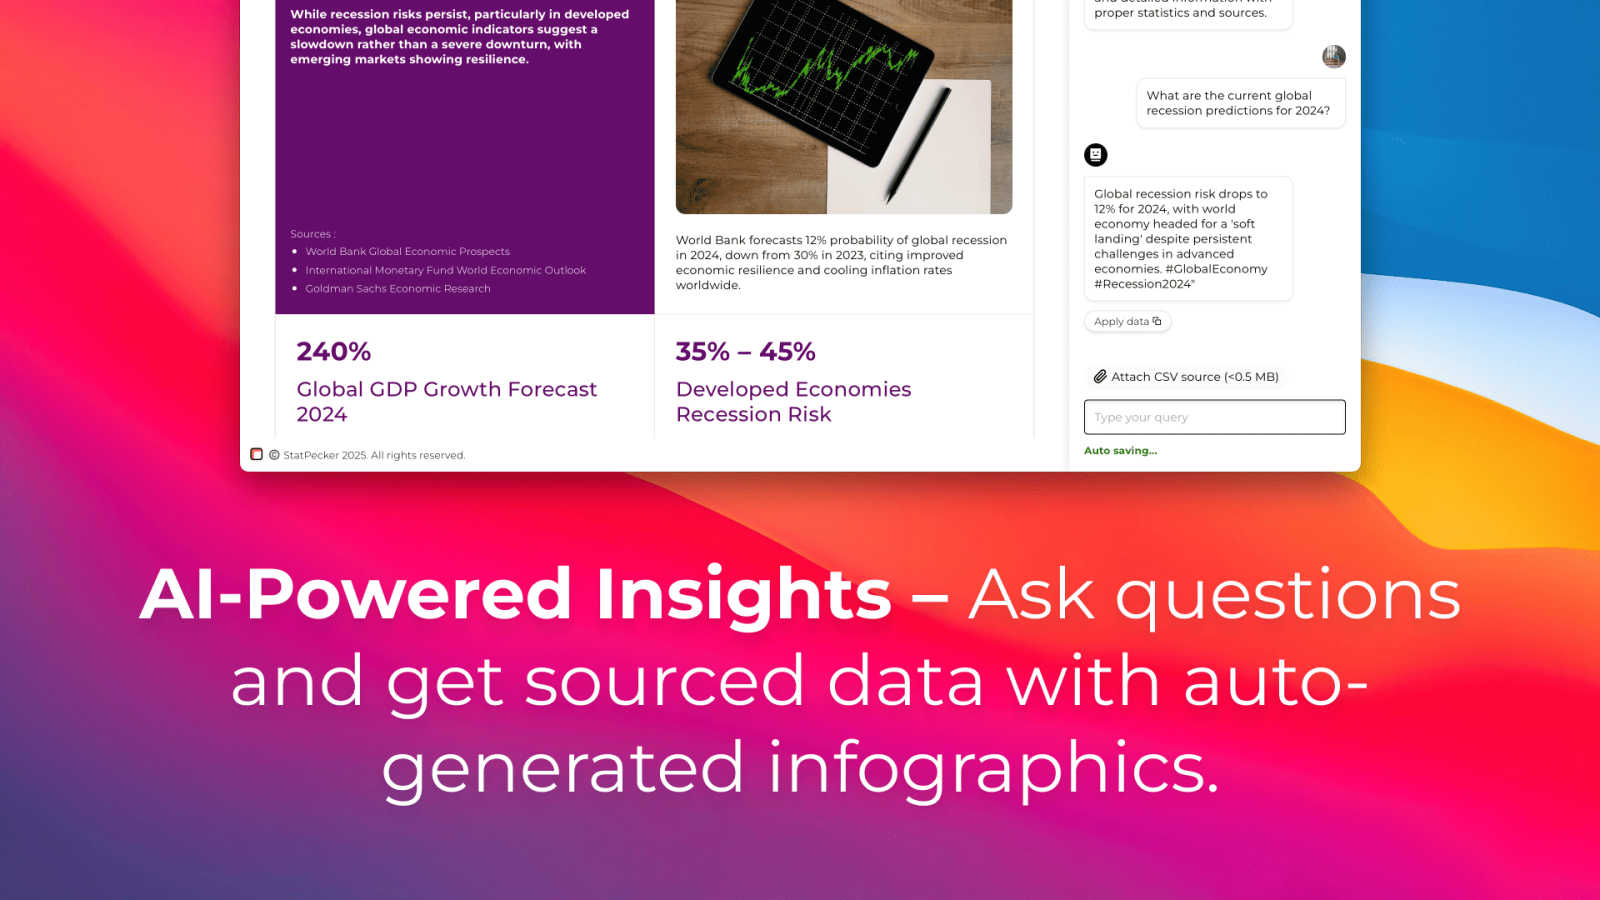
StatPecker
StatPecker delivers fast, secure data insights and stunning visuals, empowering leaders and creators to tell compelling.
Last updated: March 1, 2026
Visual Comparison
Skippership
StatPecker
Feature Comparison
Skippership
AI-Powered Session Replays
Go beyond simple playback. Skippership's session replays are enhanced with AI to automatically flag critical moments like rage clicks, hesitation, and sudden exits. Watch real user journeys to uncover usability issues and conversion blockers without sifting through hours of footage. The AI highlights the sessions that matter most, turning qualitative observation into quantifiable, actionable insight instantly.
Interactive Heatmaps (Click, Scroll, Move)
See exactly where user attention concentrates and dissipates. Skippership generates dynamic heatmaps that visualize clicks, scroll depth, and mouse movement, revealing which parts of your pages are engaging and which are being ignored. This visual data is crucial for optimizing page layouts, call-to-action placements, and content strategy to dramatically boost engagement and guide users toward conversion.
Intelligent Goal & Funnel Tracking
Define and track key user actions—like purchases, sign-ups, or feature adoption—with pinpoint accuracy. Skippership's goal tracking monitors these conversion points in real-time, allowing you to measure performance, identify drop-off stages in your funnels, and understand the precise patterns that lead to success or abandonment.
Privacy-First AI Analytics Engine
This is where Skippership truly stands out. Its core AI engine processes behavioral data to automatically spot trends, predict user struggles, and generate clear recommendations—all while prioritizing privacy. It processes only the essential interaction data, never personal or sensitive information, ensuring powerful insights align with GDPR and CCPA standards.
StatPecker
Local SQL Agent
StatPecker's Local SQL Agent empowers users to analyze data locally with an easy-to-use interface. By uploading a CSV file (up to 50 MB), users can run queries and receive instant visualizations that can be shared effortlessly. This feature ensures privacy, as all data processing occurs on the user's device, eliminating concerns about data security.
Ask Your Query
With the Ask Your Query feature, users can generate insights directly by posing questions in natural language. This AI-driven capability removes the need for complex commands or extensive training, allowing users to quickly obtain validated answers from their data. It streamlines the exploration process, making data-driven insights accessible to everyone.
Publish & Embed
StatPecker allows users to publish and embed their infographics seamlessly into various platforms, including blogs, articles, and websites. This feature enhances interactivity and engagement, enabling content creators to integrate visually compelling data narratives that resonate with their audience and drive higher engagement rates.
Download & Use Anywhere
Users can easily export their infographics as image files, making it convenient to use them in reports, presentations, or any other medium. The Download & Use Anywhere feature empowers users to leverage their visuals across multiple platforms without limitations, ensuring that impactful data storytelling is always at hand.
Use Cases
Skippership
Reducing E-commerce Cart Abandonment
Pinpoint the exact moment and reason shoppers abandon their carts. Use session replays to watch frustrated clicks on a broken coupon field or heatmaps to see if shipping information is overlooked. Implement data-driven fixes to streamline the checkout process, directly recovering lost revenue and boosting conversion rates.
Optimizing Landing Page Performance
Move beyond bounce rate metrics. Analyze heatmaps to see if visitors are scrolling to your key value proposition and using session replays to observe their first impressions. Identify if a confusing headline or a weak call-to-action is causing drop-offs, then A/B test changes informed by concrete behavioral evidence to improve lead generation.
Improving SaaS Product Onboarding
For product managers, understanding where new users get stuck is critical. Track goals for completing onboarding steps and use AI-analytics to identify common friction points in the journey. Watch session replays of users who churned early to redesign tutorials and UI elements, strengthening user retention from day one.
Validating Website Redesigns & Updates
Before and after a major site update, use Skippership to gather empirical evidence of its impact. Compare heatmap engagement and session replay behavior to see if the new design guides users more effectively toward goals. This eliminates guesswork, ensuring design decisions are validated by actual user interaction data.
StatPecker
Content Creation for Blogs
Bloggers can leverage StatPecker to create stunning infographics that enhance their articles. By transforming complex data into visual stories, they can increase reader engagement and comprehension, making their content more shareable and appealing.
Marketing Campaign Reports
Marketers can utilize StatPecker to visualize campaign performance data effectively. By generating clear and impactful reports, they can present insights to stakeholders in a visually engaging manner, aiding in decision-making and strategy adjustments.
Educational Presentations
Educators can simplify complex subjects by using StatPecker to create infographics that illustrate key concepts. This visual approach enhances students' understanding and retention of information, making learning more interactive and enjoyable.
Data Analysis for Businesses
Analysts can use StatPecker to quickly visualize data from CSV files without the need for extensive BI tools. This ability to generate instant insights helps businesses make informed decisions based on credible data, driving productivity and efficiency.
Overview
About Skippership
Stop guessing what your users want and start knowing. Skippership is the next-gen AI-powered analytics platform that's redefining how businesses understand digital behavior. In an era where every click and scroll tells a story, traditional analytics tools drown you in data without revealing the "why" behind user drop-offs and cart abandonment. Skippership cuts through the noise, delivering crystal-clear, actionable insights that directly boost engagement and revenue. Designed for forward-thinking website owners, product managers, and marketers, it consolidates session replays, interactive heatmaps, goal tracking, and AI-driven journey analysis into one intuitive dashboard. This isn't just about tracking users; it's about uncovering hidden friction points, decoding user intent, and providing the clarity needed to make confident, data-driven decisions that optimize conversions. With a no-code setup that integrates in minutes and a privacy-first architecture compliant with GDPR and CCPA, Skippership is the essential, smart-choice tool for any company serious about enhancing its online performance and driving sustainable growth.
About StatPecker
In today's data-driven landscape, the ability to present information in an engaging and visually appealing manner is crucial. StatPecker revolutionizes this need with its AI-powered platform that transforms raw data into captivating infographics in mere seconds. Designed for a diverse audience, from content creators and marketers to analysts and educators, StatPecker eliminates the headache of traditional data visualization tools. Users can effortlessly convert complex datasets into clear visuals that enhance communication and decision-making. With StatPecker, the process of data storytelling is simplified, allowing users to focus on insights rather than technical hurdles. The platform's promise of fast, cost-effective, and hassle-free data visualization enables anyone to create professional-grade graphics that captivate audiences and drive engagement.
Frequently Asked Questions
Skippership FAQ
How does Skippership's AI differ from other analytics tools?
While many tools simply collect data, Skippership's AI is built for interpretation and alerting. It actively analyzes session recordings and interaction data to automatically detect patterns like rage clicks, hesitation loops, and unexpected exit points. Instead of you searching for problems, Skippership's AI surfaces the most critical friction points with clear insights, telling you not just what happened, but why it likely happened and where to focus.
Is Skippership compliant with data privacy regulations like GDPR?
Absolutely. Privacy and compliance are foundational to Skippership. The platform is engineered to align with GDPR, CCPA, and other major privacy frameworks. It uses a privacy-by-design approach: data is secured with SSL/TLS encryption, stored on secure cloud infrastructure, and the system is configured to avoid processing personal or sensitive information. You maintain control over your data collection.
What is the performance impact of installing Skippership on my website?
Skippership is engineered for minimal performance impact. The tracking script is lightweight and asynchronous, meaning it loads without slowing down your page rendering or affecting core web vitals. You get comprehensive insights without compromising your site's speed or user experience, which is itself a critical factor for conversion.
Can non-technical team members use Skippership effectively?
Yes, its user-friendly design is built for everyone. The no-code setup gets you started in minutes by simply adding a snippet to your site. The dashboard presents complex behavioral data through intuitive visualizations like heatmaps and easy-to-navigate session recordings, enabling marketers, product managers, and other non-technical roles to derive powerful insights without needing a data scientist.
StatPecker FAQ
How secure is my data when using StatPecker?
StatPecker prioritizes data privacy by processing all information locally on your device. This means that your data remains secure and is not transmitted over the internet, ensuring confidentiality.
Can I embed my infographics in social media?
Yes, StatPecker allows you to publish and embed your infographics across various platforms, including social media, blogs, and websites. This feature helps increase visibility and engagement with your content.
Is there a learning curve to using StatPecker?
Not at all! StatPecker is designed for users of all skill levels. Its intuitive interface and natural language query feature make it easy for anyone to generate insights and create stunning visuals without prior experience.
What types of files can I analyze with StatPecker?
Currently, StatPecker supports CSV file uploads, allowing users to analyze datasets of up to 50 MB. This capability enables users to extract valuable insights from their existing data without the need for complex software.
Alternatives
Skippership Alternatives
Skippership is a leading AI-powered analytics platform in the user behavior and conversion optimization space. It combines session replays, heatmaps, and AI-driven insights to help businesses understand visitor drop-offs and boost engagement. This category is exploding as companies double down on data-driven user experience. Users often explore alternatives to find a better fit for their specific needs. Common drivers include budget constraints, the need for integration with a particular tech stack, or a desire for more specialized features like advanced A/B testing or deeper e-commerce analytics. The market is rapidly evolving, with new players offering niche capabilities. When evaluating alternatives, focus on core functionality, data privacy compliance, and real-time analytics power. Look for platforms that not only identify friction points but also provide clear, actionable recommendations. The best tool seamlessly fits your workflow and scales with your growth, turning raw behavioral data into a competitive edge.
StatPecker Alternatives
StatPecker is an innovative tool that harnesses the power of AI to deliver fast and secure insights from data, focusing on creating stunning visualizations. As a leader in the analytics and data category, it empowers users to turn complex datasets into impactful infographics effortlessly. However, users often seek alternatives due to various reasons such as pricing constraints, the need for specific features, or compatibility with different platforms. When searching for an alternative, it's essential to consider factors like ease of use, the ability to integrate with existing tools, the quality of visualizations produced, and the overall value provided. A good alternative should streamline the data storytelling process while still offering robust analytical capabilities and exceptional support for users of all skill levels.